
25 Sept 2026
Author
Gorakh Shrestha


Slow software rarely announces itself with an incident, which makes it hard to raise and harder to fund. This article gives you a way to show it: six causes to check, five numbers your team can usually pull from tools it already runs, and a three-question test you can answer this quarter.

Why we wrote this
Nothing broke, so why does everything feel heavier?
It's the Monday operations review. The month-end reconciliation report used to load in twenty seconds. Now people start it, make a coffee and hope.
The short answer: Software slows down through drift: data grows, dependencies age and quick fixes pile up, and none of it is anyone's job to notice. You can't stop growth, but you can see drift early. Track five measures every quarter and reserve a fixed share of engineering time to fix what they show.
Why your monitoring doesn't catch it
Most monitoring is built to catch events. An alert fires when response time crosses a threshold or a server falls over. Drift doesn't do either: it's a slope, not a spike, so it never trips the alarm.
Here's the concession. Some drift is simply the cost of growth, because more customers mean more data and more work for the system. The goal isn't zero change, it's telling growth you're happy to pay for apart from waste.
Six causes of drift, and five ways to measure it
The six causes
Most slow, expensive systems show a mix of these six. Each one is normal on its own. The trouble starts when they compound unmeasured.
|
Cause
|
What it is
|
What it looks like
|
What good looks like
|
|---|---|---|---|
|
Data growth
|
Data keeps growing; the code reading it doesn't change
|
Queries written for ten thousand rows now scan ten million
|
Slowest queries reviewed quarterly; old data archived
|
|
Ageing dependencies
|
Libraries and runtimes fall behind
|
Versions out of support; upgrades feel risky
|
Small upgrades as part of normal work
|
|
Quick fixes that stayed
|
Workarounds that never got a proper fix
|
Last year's incident patch still in production
|
Every workaround has a removal date
|
|
Features that never leave
|
Functionality kept after people stop using it
|
Unused screens, flags and integrations still maintained
|
Unused features retired on purpose
|
|
Infrastructure and logging sprawl
|
Capacity and logging that grow but never shrink
|
Servers sized for an old peak; logs kept forever
|
Sized to real load; logs filtered before they're kept
|
|
Lost context
|
Why things were built leaves with people
|
Fixes repeating old mistakes; modules nobody touches
|
Decisions written down where the next engineer looks
|
The five measures
You don't need a new tool to start. The data usually sits in your monitoring, deployment pipeline, ticketing system and cloud bill already. Compare each number with itself a year ago, not with a threshold.
1. Response time trend
-
What it is: how long the system takes to answer, tracked quarterly. Use the 95th percentile, the time 95 of every 100 requests beat, so slow outliers can't hide in an average.
-
What it looks like: key screens and reports creep up a little each quarter, and nobody notices until a customer does.
-
What good looks like: your five busiest journeys stay flat or get faster as users grow.
2. Release lead time
-
What it looks like: a one-line fix needs a week of testing, because nobody trusts what else it might touch.
-
What good looks like: lead time is stable or falling, and small changes ship in small batches.
3. Incident rate
-
What it is: production incidents per month, split by cause.
-
What it looks like: the same handful of problems keep returning, each fixed again by hand.
-
What good looks like: incidents trend down, and repeats get a permanent fix rather than another patch.
4. Cloud cost per user or transaction
-
What it is: your cloud bill divided by a unit the business cares about. The FinOps Foundation calls this unit economics and lists cost per customer and per transaction among its examples.
-
What it looks like: the bill grows faster than customers or transactions.
-
What good looks like: unit cost holds or falls as volume grows. A rising bill with a falling unit cost is healthy growth.
5. Fix versus new work share
-
What it is: the share of engineering time spent on fixes, rework and firefighting, against new work. DORA tracks a cousin of it, deployment rework rate: unplanned deployments caused by production incidents.
-
What it looks like: the team is flat out all quarter, yet the roadmap barely moves.
-
What good looks like: the split is known, and the fix share is shrinking or held at a level you chose.
When a rebuild is the honest answer
Measuring and fixing drift works for most systems. Not all of them, and it's better to say so early.
Sometimes the honest answer is simpler still. If a system is due to be retired within a year, keep it stable and put the effort into its replacement.
What this looked like at Nuvei
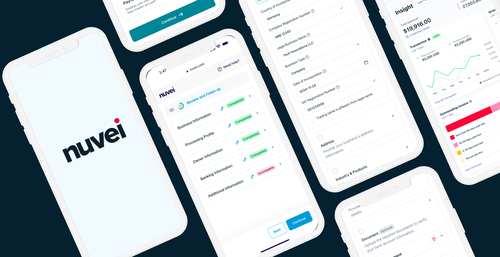
Nuvei was handling 3 million data points a day, with security and server capacity stretched. An AI-native filtering workflow now monitors application performance, with a 10x reduction in log usage and Azure cost.
Filtering before storage changes both sides of that equation. Routine noise is set aside before it's kept, so there is far less to pay for. And a stretched team sees the signals that matter, instead of searching for them in a flood.
What drives the effort and cost
Fixing drift isn't free, and the effort depends mostly on where the system starts. Three things move it most:

System age

Data volume

Existing monitoring
How we approach it

NEXUS Sustain
Check your own system
Frequently Asked Questions

Gorakh excels in leadership and web development, driving excellence. Always ready for new challenges, he fosters growth for himself and his team.
Read more Articles by this Author