A/B Testing Explained: Methods, Key Benefits, and Best Practices

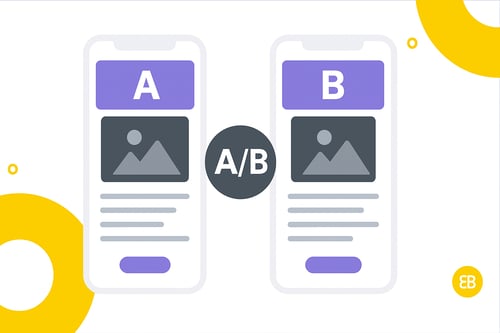
A/B testing is the practice of launching two versions of the same feature—screen, button, copy, or flow—at the same time and letting real users decide which one is better. One half of the audience sees Version A (the control), the other half sees Version B (the variant). You then track a single “north-star” metric—such as sign-ups or purchases—to declare a winner. Simple, scientific, and far more reliable than gut feel.
Why Does A/B Testing MattersA short experiment can settle months of debate. That alone should catch a founder’s attention, but the upside runs deeper:
-
Higher conversions: Micro-changes in colour, wording, or layout can trigger measurable lifts.
-
Lower risk: New ideas reach only a slice of users first; you can roll back quietly if they flop.
-
Smarter budgets: Dev hours go into proven improvements, not hunches.
-
Faster momentum: Tight feedback loops connect design, engineering, and real-world data—accelerating every future release.
In other words, A/B testing replaces opinion with evidence and turns product bets into calculated moves.
When to Use A/B Testing
-
Onboarding friction – Two sign-up journeys (quick-tap vs. guided) to see which converts best.
-
Pricing page anxiety – Different layouts or CTAs to reduce checkout abandonment.
-
CTA copy debates – “Start Free Trial” versus “Get Started.”
-
Funnel optimisation – Identifying the strongest screen sequence for upsells, referrals, or renewals.
-
Feature validation – Gauging whether a new icon, animation, or placement actually helps users.
Real-World Example
During project’s sprint to 10 000 users, we pitted a minimal-taps onboarding flow against a guided-tour flow. The leaner journey won by an 18 percent lift in verified sign-ups over two weeks—evidence that “less is more” for first-time property buyers.
Founder Insight
Running a test on a tiny pool is like flipping a coin three times and crowning heads the champion. Always calculate the minimum sample size required for statistical significance before you trust any result. Free online calculators will do the maths.
Key Metrics / Concepts
| Concept | Why It Matters |
|---|---|
| Conversion Rate | Core outcome—what percentage of users completed the desired action |
| Statistical Significance | Confidence that the result isn’t random noise |
| Sample Size | Ensures enough data points to reach significance |
| Test Duration | Protects against weekday, seasonality, or campaign bias |
| Control vs. Variant | Baseline experience versus the challenger |
Tools & Technologies
-
Firebase A/B Testing – Seamless for iOS and Android; results feed into Google Analytics.
-
Optimizely Feature Experimentation – Enterprise-grade targeting and gradual roll-outs behind feature flags.
-
Mixpanel Experiments – Rich event analytics coupled with significance calculations.
What’s Next / Future Trends
Adaptive testing is gaining ground. AI-powered platforms route more traffic to the better-performing variant the moment confidence rises, accelerating wins and shutting down weak ideas early.
Related Terms
Helpful Videos / Articles / Pages
Want to Dive Deeper into A/B Testing?
Still wondering whether A/B testing could shift your key metrics? Book a discovery call with our team and let’s design experiments that turn opinion into certainty—and certainty into growth.